
Simple Web-Based Visual Analytics with SWeVA
Purpose
Simple Web-Based Visual Analytics (SWeVa) is an extensible Web-based visual analytics platform that can be used for analyzing aspects of software development and usage inside a community [1], as well as to support learning analytics [2]. Supporting the Visual Analytics Mantra “Analyze First - Show the Important - Zoom, Filter, and Analyse Further Details on Demand” [3], SWeVA provides a browser-based interface for the graph-based composition of interactive data visualizations. Visualizations are generated following the cutting-edge Web component specifications and thus support simple and comfortable re-use in arbitrary Web page contexts. Another specialty of SWeVA is its support for real-time collaborative data visualization authoring, using the Yjs framework.
Description
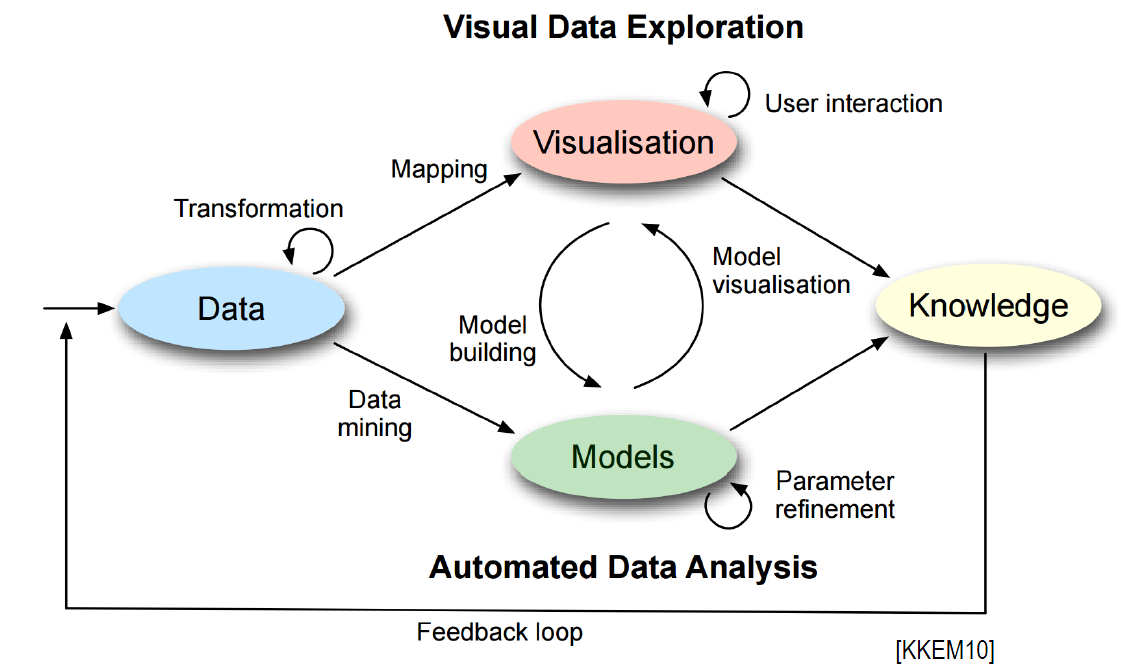
In general, SWeVA follows the standard visual analytics work flow [4], depicted in Fig. 1. In order to guarantee an appropriate technical separation of concerns, SWeVA is divided into two major parts: a core framework and a collaborative visualization tool. The Core Framework follows the instructions in a data processing model to compute visualizable results for the Collaborative Visualization Tool. It works with a service-oriented architecture, where specialized remote services are orchestrated to request and process data. Additionally, it supports local computations that can be used for simple operations and to make the data compatible among the services. The orchestrated services generally do not know anything about each other, so the APIs might not be directly compatible regarding the used data structures.
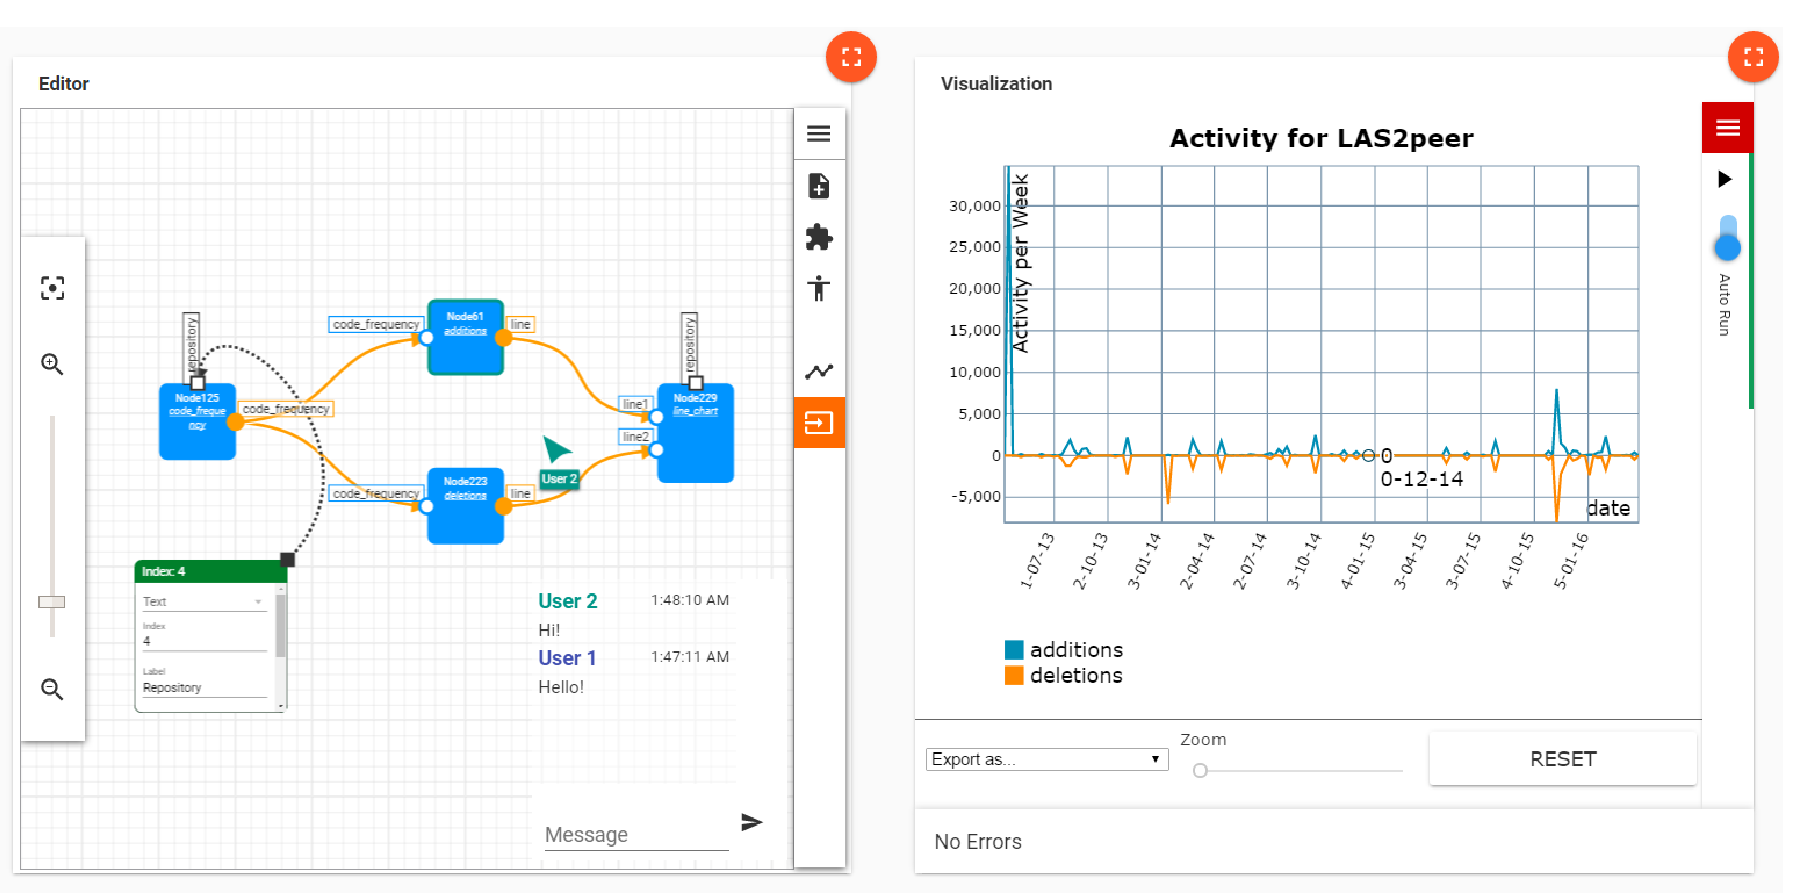
The Collaborative Visualization Tool is responsible for visualization, interaction and knowledge gain in the visual analytics process. Fig. 2 shows the user interface of the collaborative visualization tool. It supports the creation and customization of arbitrary visualization techniques. It therefore follows a modularized approach, where visualization techniques are not predefined, but loaded on demand. Many of the responsibilities relating the visualizations are held by visualization modules. They control how exactly the data is represented and rendered, how hypotheses are included in it and even what interactivity options users are offered. The process of rendering gives the foundation for the ability to export visualizations, which is a part of knowledge sharing. An important key concept of visual analytics is showing an initial overview and allowing the display of further details on demand. For the collaboration on visualization creation and use, SWeVA thus supports the following principles:
-
Information Overview: Developers should initially display an overall overview of all the given data. Users can then decide what to explicitly focus on by providing additional parameters or using some form of zooming. Zooming can gradually reveal more detailed information depending on the zoom level. An online map is a good example for such a feature: it does not show street names all the time but only when the user zoomed far enough into the map.
-
Predictions and Interesting Areas: Visualization modules must consider how to display hypotheses. This can be done by adding a hypothesis just like regular data, but with a different color. An example would be a line chart showing a time series of both the original data and a prediction. An additional method is the ability to mark regions of interest with rectangles, lines or circles alongside the data visualization.
-
Search and Filter: When a lot of information is displayed, but the user knows already what he wants to focus on a feature to highlight elements, the user is interested in, or hiding uninteresting elements can save time and improve the workflow. An example would be the ability to search for a person on a social network graph.
-
Export: Developers should include the ability to export the rendered visualizations, so that they can be shared with others. While a screenshot is always possible, this inconvenience should be avoided for the user, as additional work and tools could be discouraging for the sharing process. SWeVA is extensible by different formats such as vector images for better quality and lower file size or specialized formats for further processing in other tools, like GEXF for Gephi.
-
Reusability: Creating visualization modules costs time, even if there is an existing framework around it. SWeVA therefore encourages the creation of highly reusable visualization modules and sharing them in a library. This can be achieved by creating visualizations in a general way that can be configured in detail over a configuration file or parameter. An example would be to create one single visualization module for directed and for undirected graphs, instead of two separate ones. The actual display of the graphs could then be controlled by a configuration parameter.
-
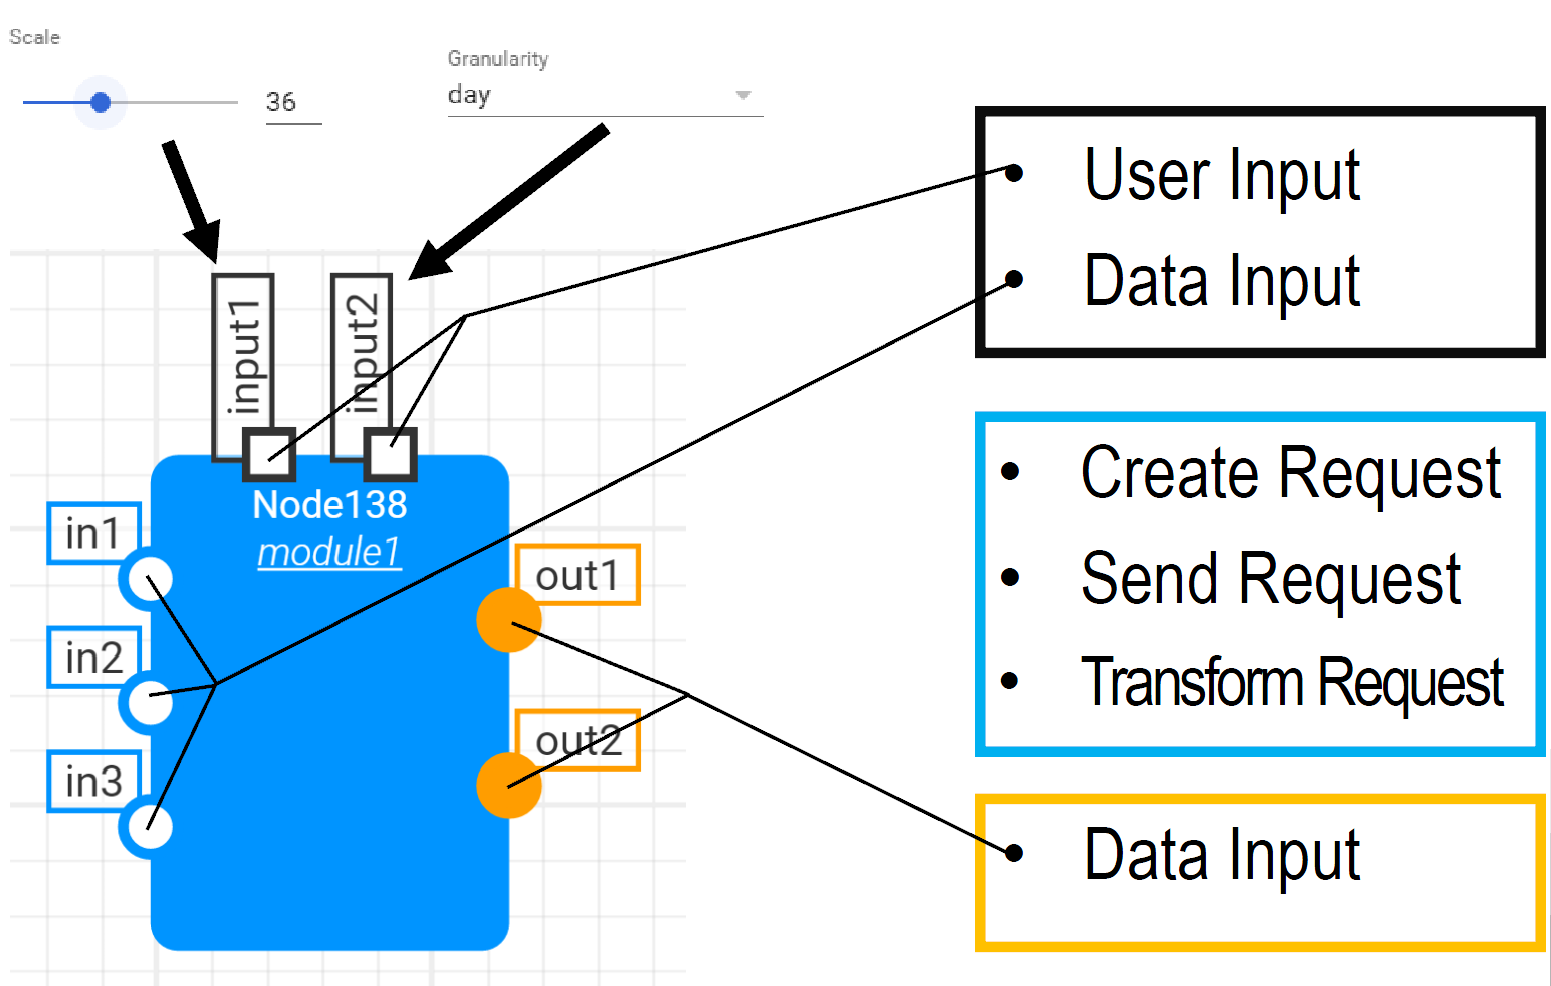
Interactive Module Visualizations: The ability to interact with the visualized data is an important part of the exploration aspect during visual analytics. SWeVA therefore features input interfaces for users, as part of every visualization module (cf. Fig. 3). The amount of variations on what interfaces users should be offered would be a limiting factor regarding module reusability. We therefore outsource parts of the interactivity into the Core Framework and include a user interface area separate from the visualization modules. Visualization modules do not need to cover all possible interactivity options, but instead the data they receive is pre-processed based on the user inputs from the separate interface. For example, a filtering feature to remove currently irrelevant elements from the visualization could be realized directly at the data processing stage in the Core Framework.
- Collaborative Knowledge Gain: The process of visualization and interaction is made collaborative to improve the discovery of insights and sharing knowledge and experience. Multiple users view the same visualization at the same time and can communicate with each other to discuss it. Due to the ability to interact with the visualization, the interactive elements are synchronized across all participants to have a consistent view. Grouping the synchronization into rooms not only allows for different groups to work independently, but also creates presets for the interactive elements. This means, that different rooms might work on the same data with the same data processing model and visualization, but different settings for user-defined input, focusing on different aspects of the visualization.
Links
Developers and Contributors
- István Koren
- Alexander Ruppert
References
- L. Corral, A. Sillitti, G. Succi, J. Vlasenko, and A. I. Wasserman, Eds., in Open Source Software: Mobile Open Source Technologies, Berlin Heidelberg, 2014, vol. 427, pp. 11–20.
- M. Derntl, N. Günnemann, and R. Klamma, “A Dynamic Topic Model of Learning Analytics Research,” in LAK (Data Challenge), 2013.
- D. A. Keim, F. Mansmann, J. Schneidewind, J. Thomas, and H. Ziegler, “Visual Analytics: Scope and Challenges,” in Visual Data Mining, vol. 4404, S. J. Simoff, M. H. Böhlen, and A. Mazeika, Eds. Berlin and New York: Springer, 2008, pp. 76–90.
- D. A. Keim, J. Kohlhammer, G. Ellis, F. Mansmann, and D. Keim, Mastering the Information Age: Solving Problems with Visual Analytics. Goslar: Florian Mansmann and Eurographics Association, 2010.