
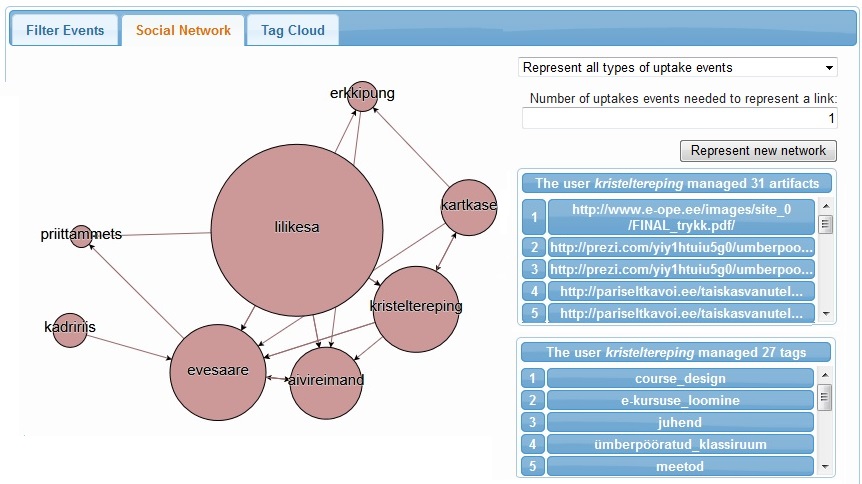
The SSS Dashboard is an application that allows end users to visualize and browse the data collected by the Social Semantic Server (SSS). It provides a set of visual abstractions suitable for learners and trainers to understand a workplace learning process according to the knowledge creation metaphor. The SSS Dashboard offers three visualizations (see Figure 1) that represent different abstractions for visualizing and browsing the SSS data, making special emphasis on the relationships between actors and artifacts.
Represent graphically the data collected from users interactions with learning tools
Offers meaningful abstractions out of the data collected by the SSS
Provide three visualizations that can be exploited for Learning Analytics
Feature list
- The first visualization lists, and allows to filter, the events collected by the SSS.
- The second visualization represents a configurable social network of the actors registered by the SSS.
- The third visualization represents a tag cloud of the tags registered by the SSS.
Uses
- Understand an informal learning practice
- Detect potential peers
- Find experts in certain topics
- Find out the topics of interest in the learning community
Tech specs
The SSS Dashboard was implemented as an independent application that consumes the data offered by the SSS. It was implemented using Javascript.
Its current version, developed for evaluation purposes, extracts the user events from the SSS data from a CSV file. Then it manipulates the data using d3 library in order to infer and represent a semantically-enriched social network (see Figure 1), and an artifact tag cloud.
Current prototype version can be downloaded from here.
The Story
The SSS Dashboard was developed at TLU based on the SSS infrastructure developed at TUG. Its main aim is to support learners and trainers to understand a workplace learning situation. Using the Dashboard the learners and trainers can visualize the several aspects of the learning situation, such as the events that occurred, the relationships between actors and between actors and artifacts, or the topics that emerged in the community of learners.
Research
The SSS Dashboard was employed in a pilot study to test the support of the SSS as a workplace Learning Analytics infrastructure. In this study a group of 10 professional teachers attended a course on how to introduce new technologies and pedagogical techniques into their classes. As part of the course activities, the learners were asked to browse the Web looking for resources that could extend or contrast the information provided by the trainer. Using these resources they were asked to write blog posts where they reflected about their own teacher practice and how to introduce new technology in their own classrooms. The SSS collected the bookmarks and posts submitted by the learners and the tags they used to describe them.
Once the course finished, a trainer and a learner used the SSS Dashboard to visualize the data collected by the SSS. Both of them agreed that by using it they could better understand the learning process. Interestingly, they understood the collaboration among learners as a process mediated by artifacts. During the interview, both of them agreed that the SSS Dashboard was a useful application. However, the trainer found it interesting to understand the learning process, while the learner reduced its potential use to the identification of relevant learning artifacts or to find potential collaborators [1] [2] [3].
Links
References
- A. Ruiz-Calleja, S. Dennerlein, T. Ley, and E. Lex, “Visualizing Workplace Learning Data with the SSS Dashboard,” in Proceedings of the First International Workshop on Learning Analytics Across Physical and Digital Spaces co-located with 6th International Conference on Learning Analytics & Knowledge (LAK 2016), Edinburgh, UK, 2016, pp. 79–86 [Online]. Available at: Fulltext
- A. Ruiz-Calleja, S. Dennerlein, V. Tomberg, T. Ley, D. Theiler, and E. Lex, “Integrating data across workplace learning applications with a social semantic infrastructure,” in Proceedings of the 14th International Conference on Web-based Learning (ICWL 2015), Guangzhou, China, 2015, pp. 208–217. DOI: 10.1007/978-3-319-25515-6_19
- A. Ruiz-Calleja, S. Dennerlein, V. Tomberg, K. Pata, T. Ley, D. Theiler, and E. Lex, “Supporting Learning Analytics for Informal Workplace Learning with a Social Semantic Server,” in Proceedings of the 10th European Conference on Tecnology Enhanced Learning (EC-TEL 2015), Toledo, Spain, 2015, pp. 634–637. DOI: 10.1007/978-3-319-24258-3_76